USD
US Dollar · DXY Index
DXY −10%+ · 2025 · Fed Policy · Reserve Dynamics
Dollar Dominance at an Inflection: DXY Structural Outlook
Download PDF ↓
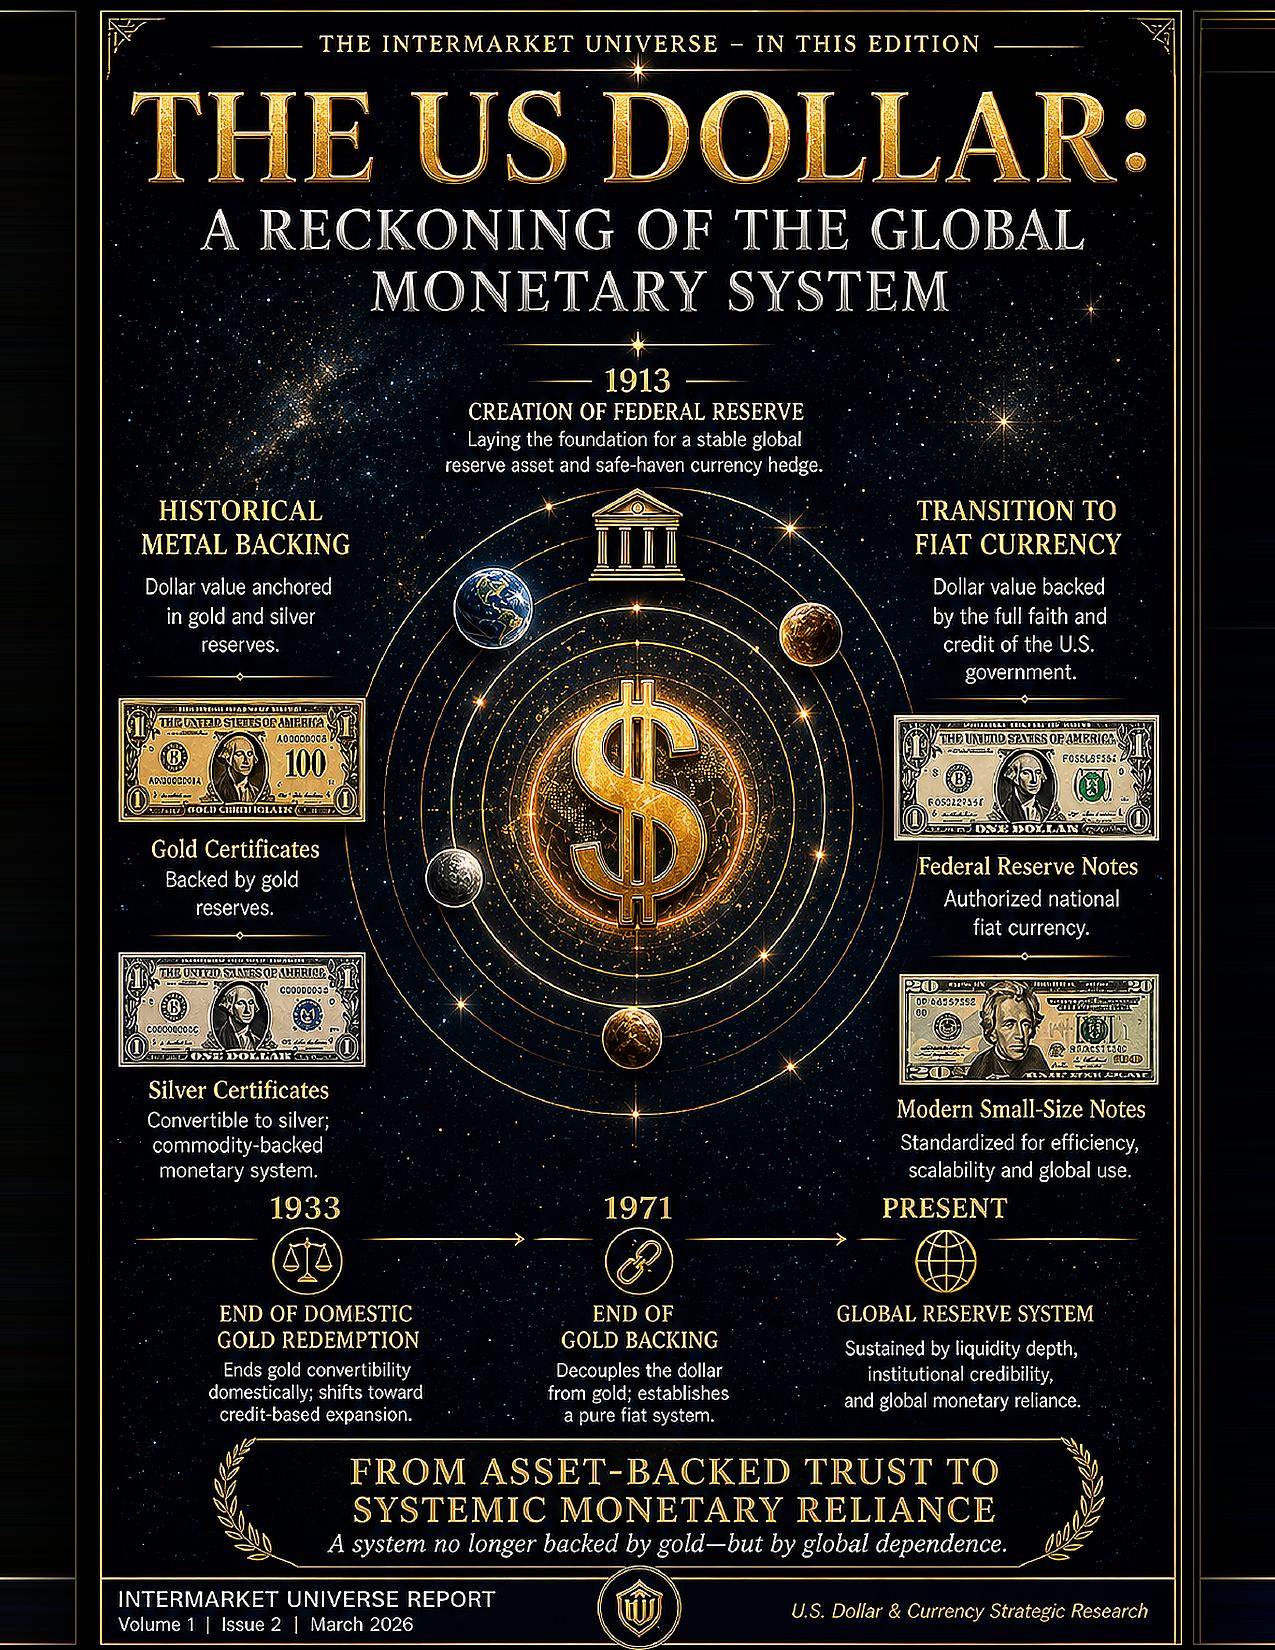
Institutional research newsletter on US dollar structural dynamics, DXY mechanics, reserve currency risk, and Fed policy divergence implications.